Portfolio Details - CFO Financial Dashboard
A one-page financial dashboard that answers what a CFO and board ask first: are we on budget, where is the margin going, and how much runway do we have?
Project information
- Category: Data Analytics & Visualization
- Client: JC Tech showcase (fictional company “NovaCloud”)
- Project date: May 2026
- Status: Live demo
- Stacks: HTML5, CSS3, JavaScript, Chart.js
Built with fictional companies and synthetic data. No client data is used in this demo.
CFO Financial Dashboard — From P&L to Runway on One Page
Finance teams often report from a stack of spreadsheets and slides, and leadership has to piece the story together: revenue is up, but is it ahead of budget? Margin moved, but why? Cash looks fine, but for how long? This dashboard shows how we would answer those questions for a mid-size SaaS company, using the fictional NovaCloud and fully synthetic data.
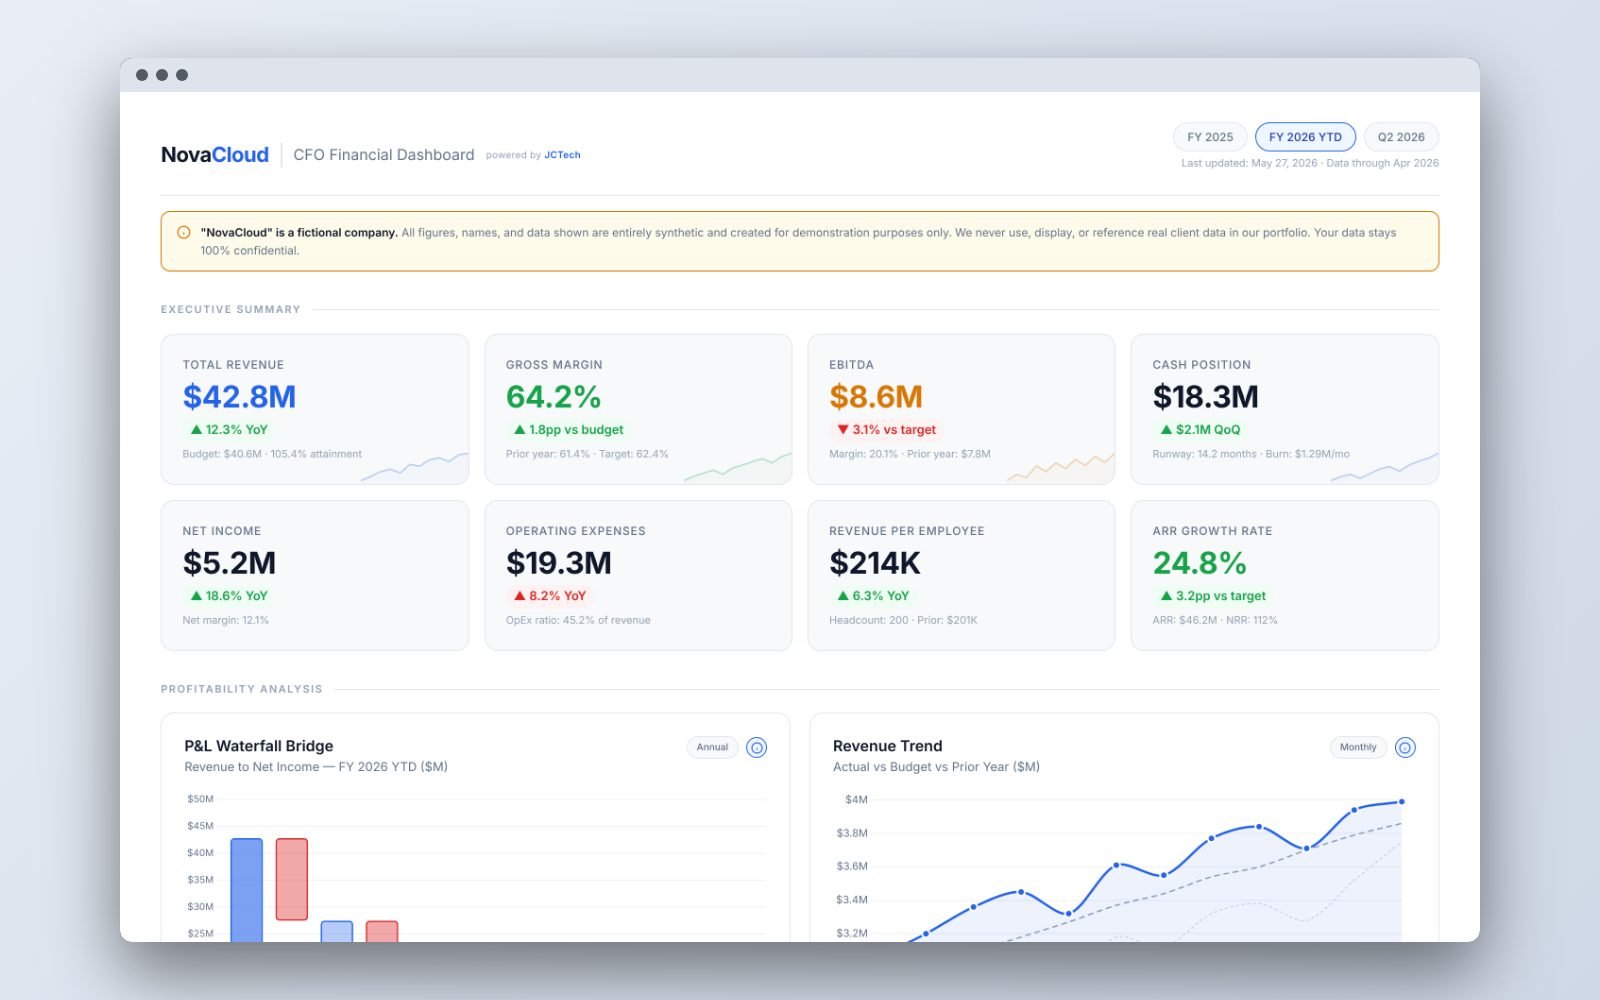
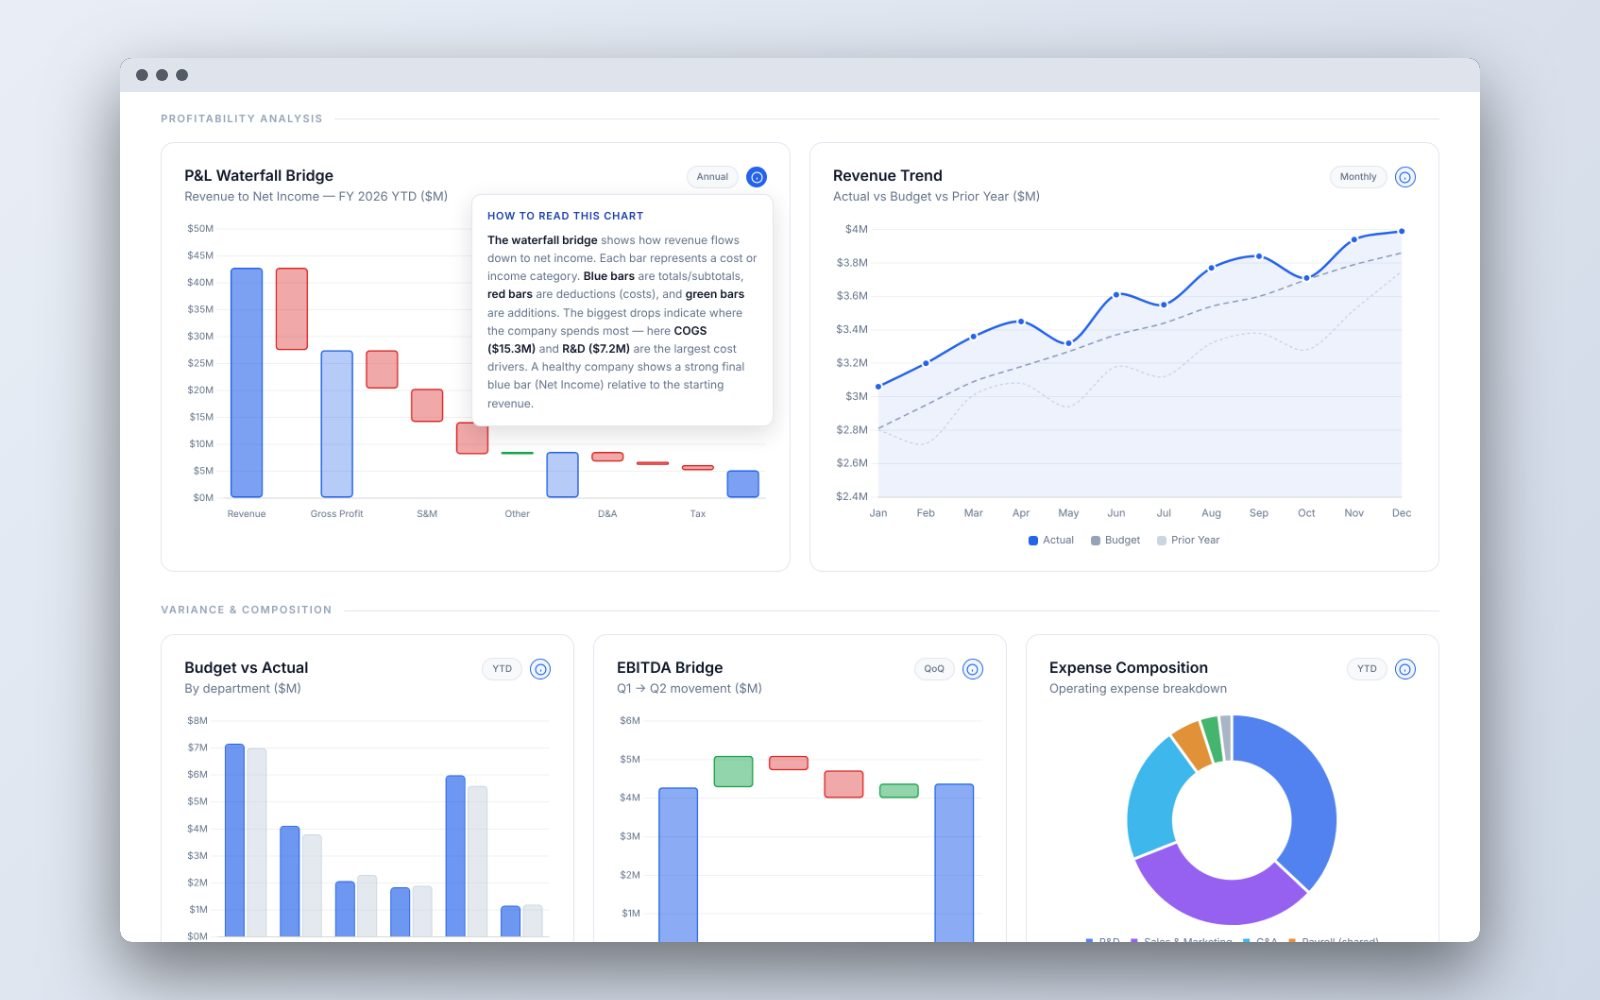
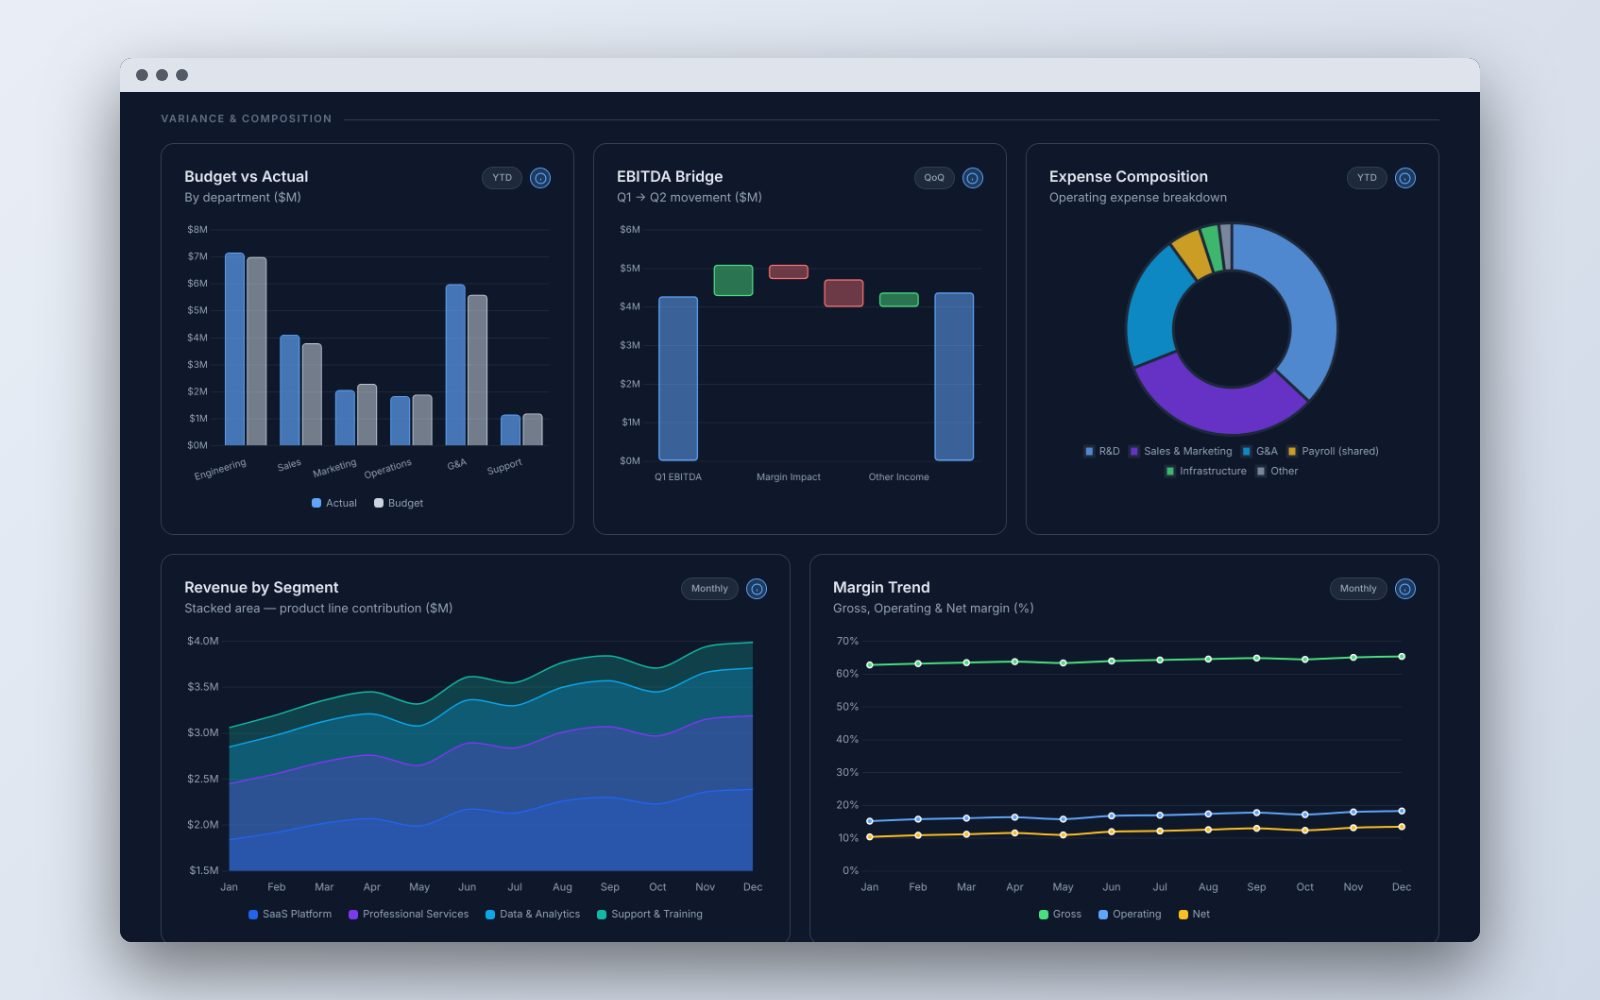
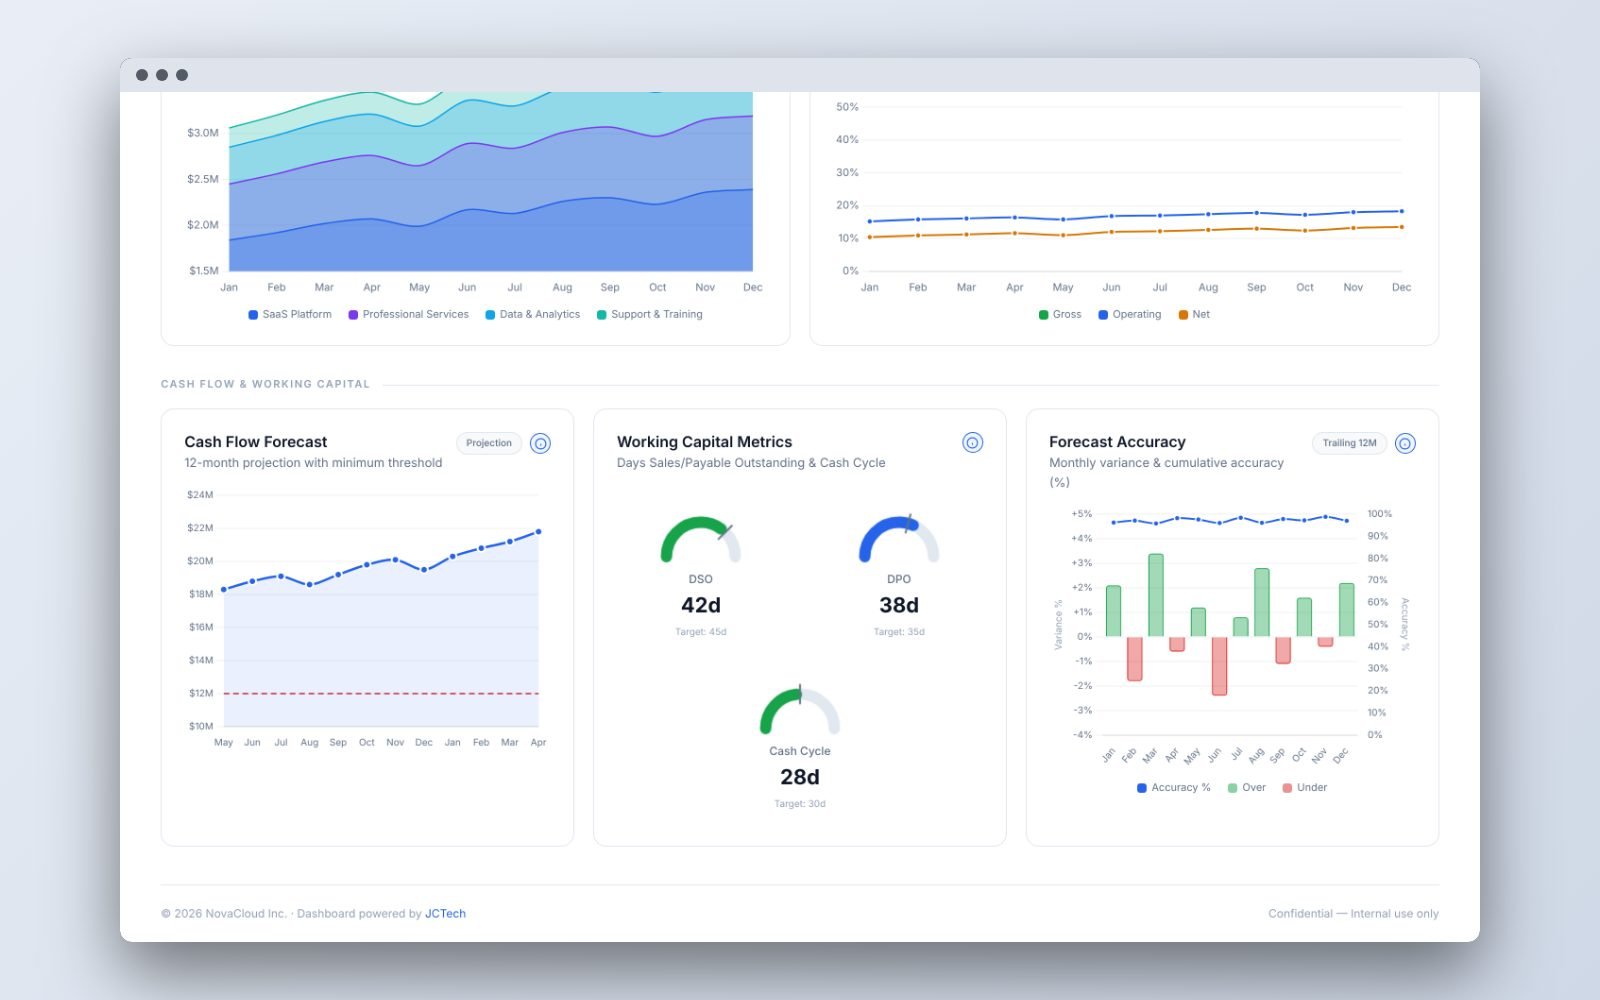
It reads top to bottom like a CFO briefing. Eight KPI cards give the headline numbers with their change against budget or last year. Below them, a P&L waterfall shows how revenue becomes net income, followed by budget vs actual by department, an EBITDA bridge, expense mix, revenue by product line and margin trends. The last section covers cash: a 12-month forecast against a minimum cash threshold, working capital gauges and forecast accuracy.
Every chart has a small “How to read this chart” guide that explains what it shows and what a good or bad pattern looks like, so board members and non-finance managers can read it without a walkthrough. For a client, the same layout can be connected to their accounting or ERP data and refreshed automatically.
Key Features
- Executive summary: eight KPI cards with change vs budget or prior year and sparklines
- P&L waterfall bridge from revenue to net income
- Revenue trend: actual vs budget vs prior year
- Budget vs actual by department, highlighting overspend
- EBITDA bridge showing what moved profit quarter on quarter
- Expense composition and revenue by product line
- Gross, operating and net margin trends
- Cash flow forecast with a minimum cash threshold and runway
- Working capital gauges: DSO, DPO and cash conversion cycle vs target
- Forecast accuracy over the trailing 12 months
- “How to read this chart” guide on every chart
- Light and dark mode, responsive on desktop and mobile