Portfolio Details - Business Intelligence Demo
A hands-on showcase of the charts and dashboards we build for any industry: explore the full visualization library, see it on sample industry dashboards, or turn your own CSV into visuals in seconds.
Project information
- Category: Data Analytics & Visualization
- Client: JC Tech showcase
- Project date: May 2026
- Status: Live demo
- Stacks: HTML5, CSS3, JavaScript, Chart.js, PapaParse
Built with fictional companies and synthetic data. No client data is used in this demo.
Business Intelligence — A Visualization Library for Any Industry
Most businesses can picture the questions they want answered, but not the charts that would answer them. This project is a hands-on showcase of what we can build: the full range of visualizations we use, shown working on realistic data, so a client can point at what they need instead of describing it.
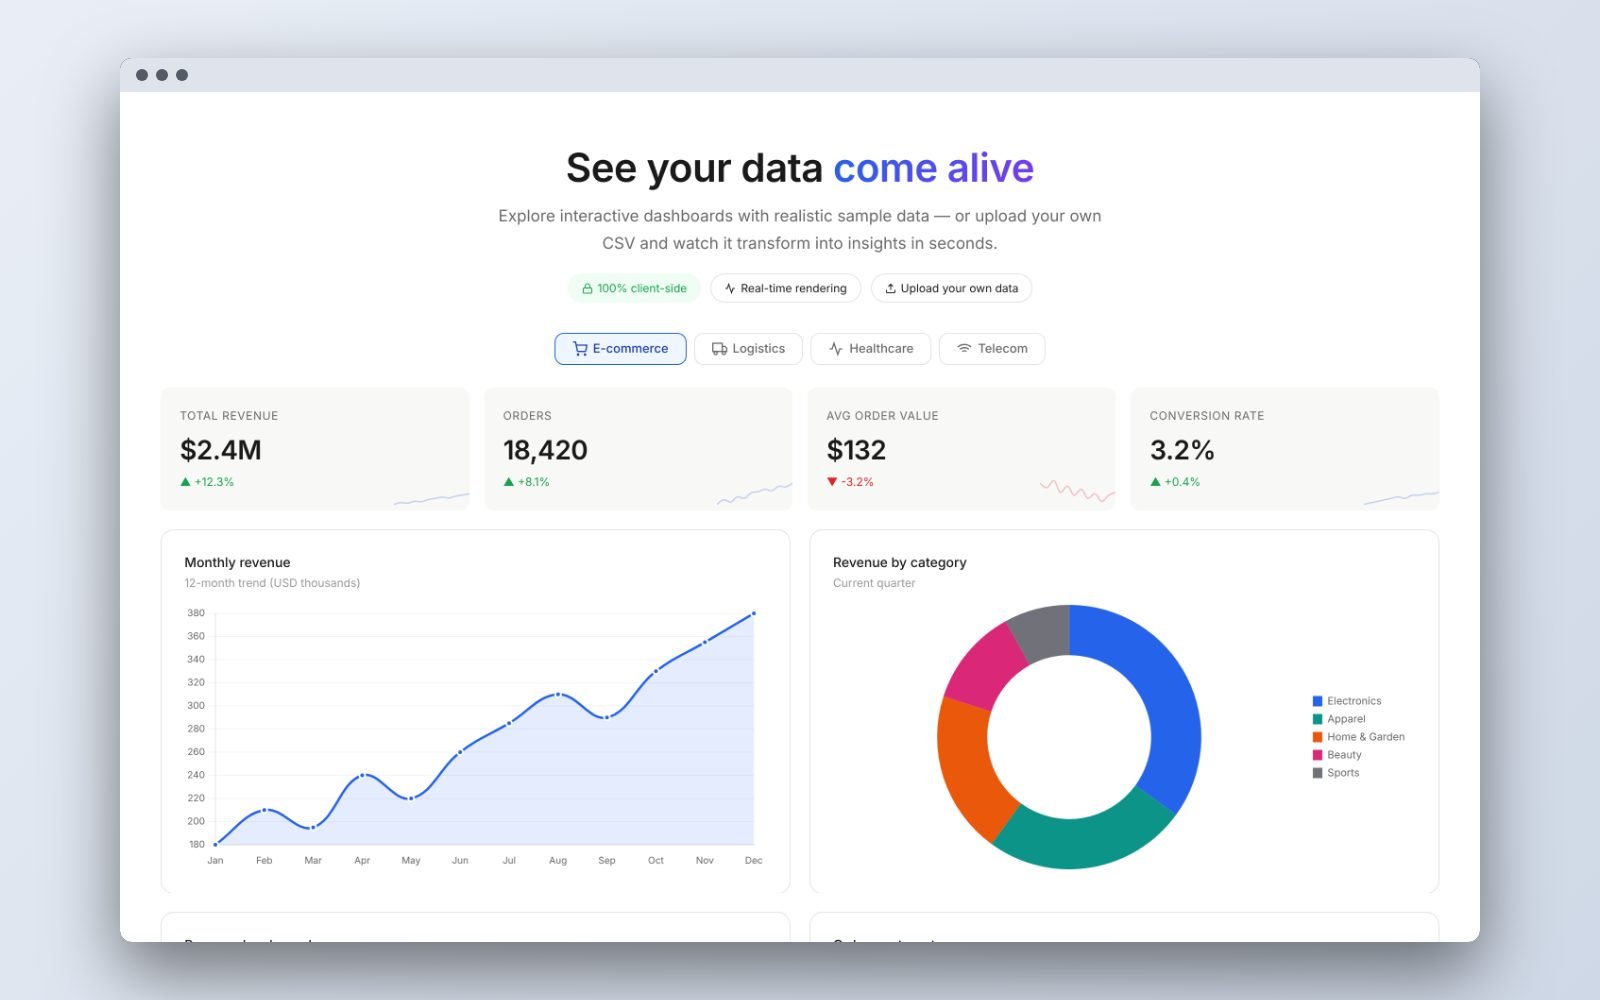
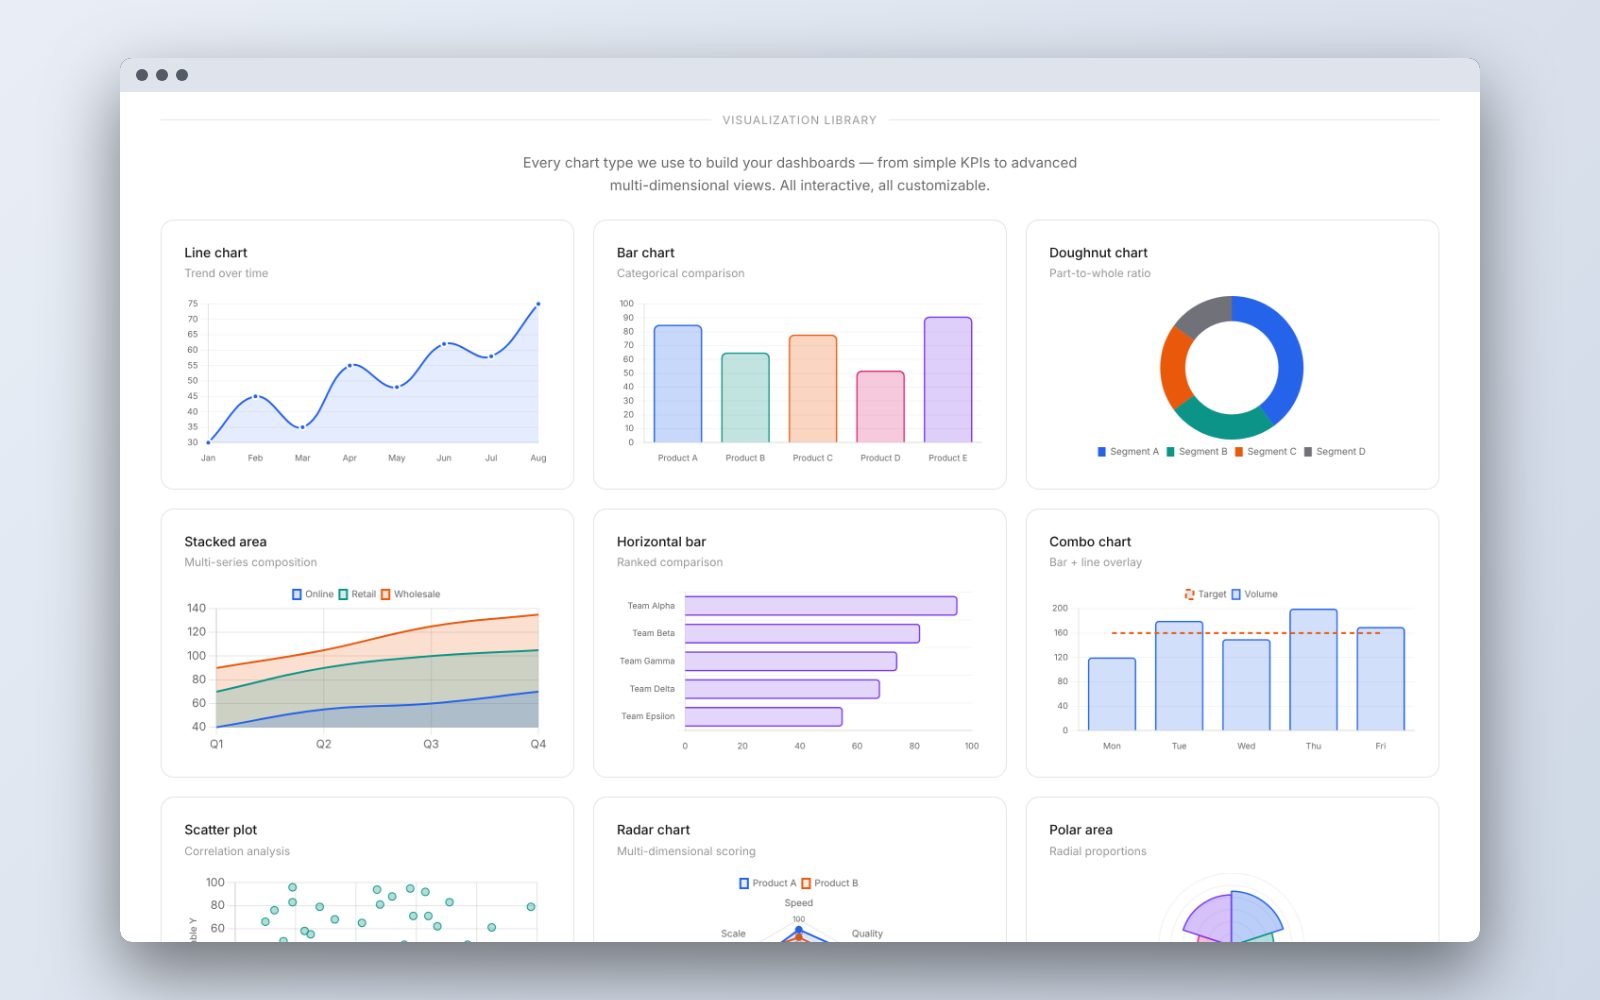
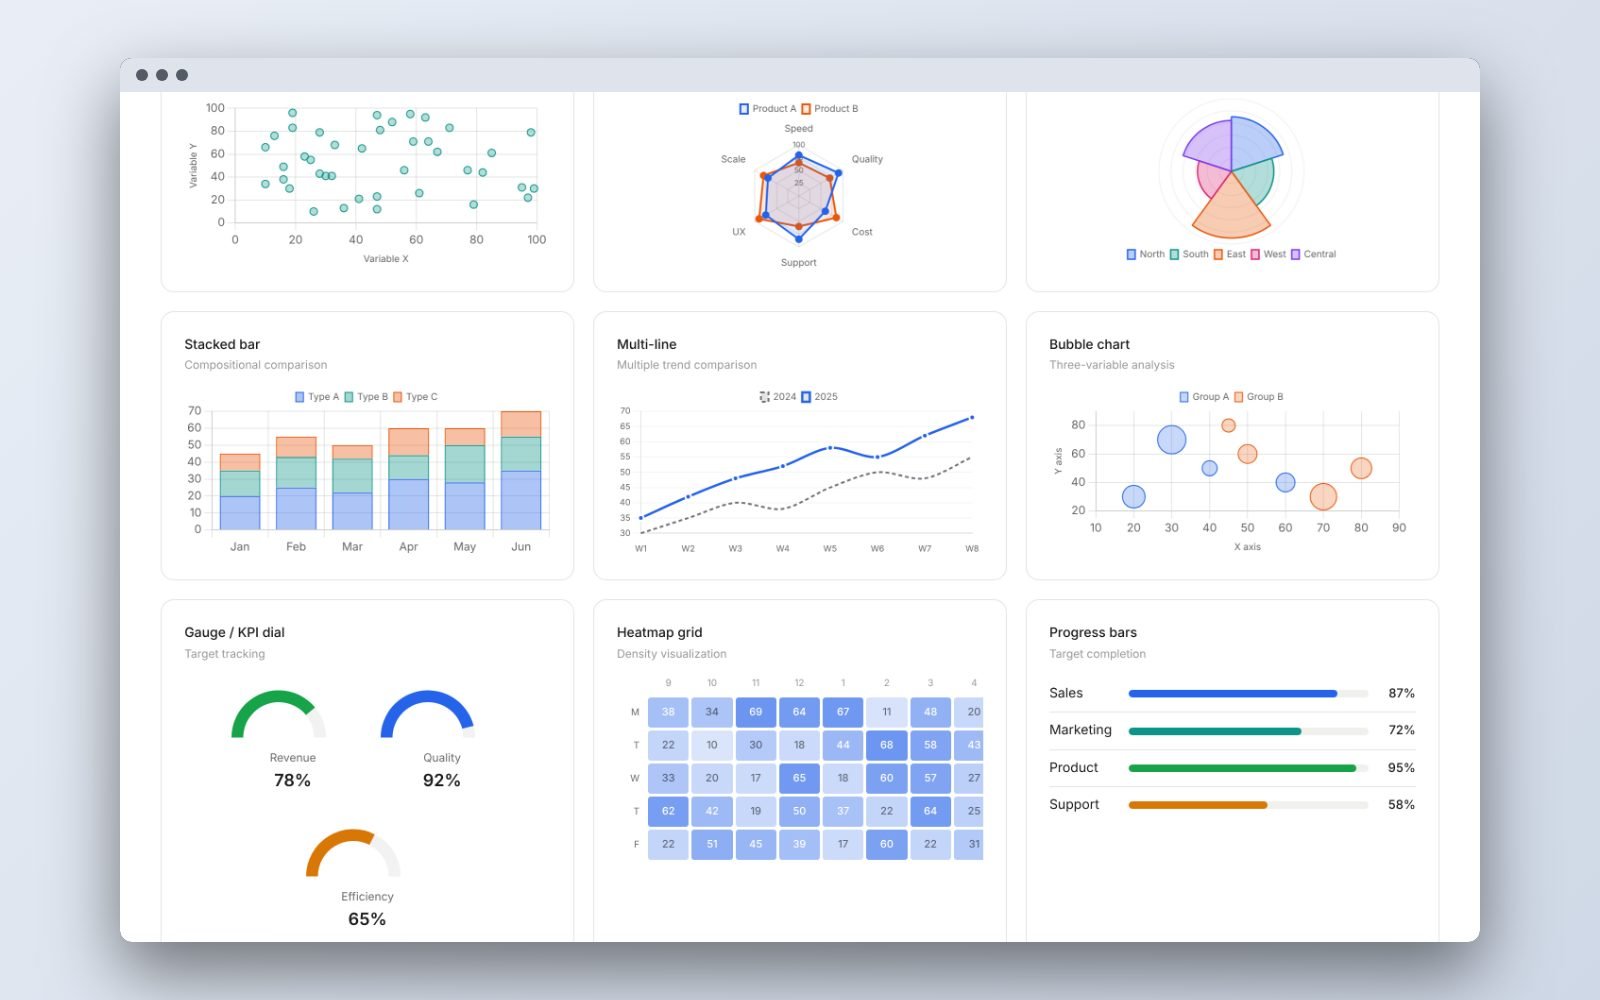
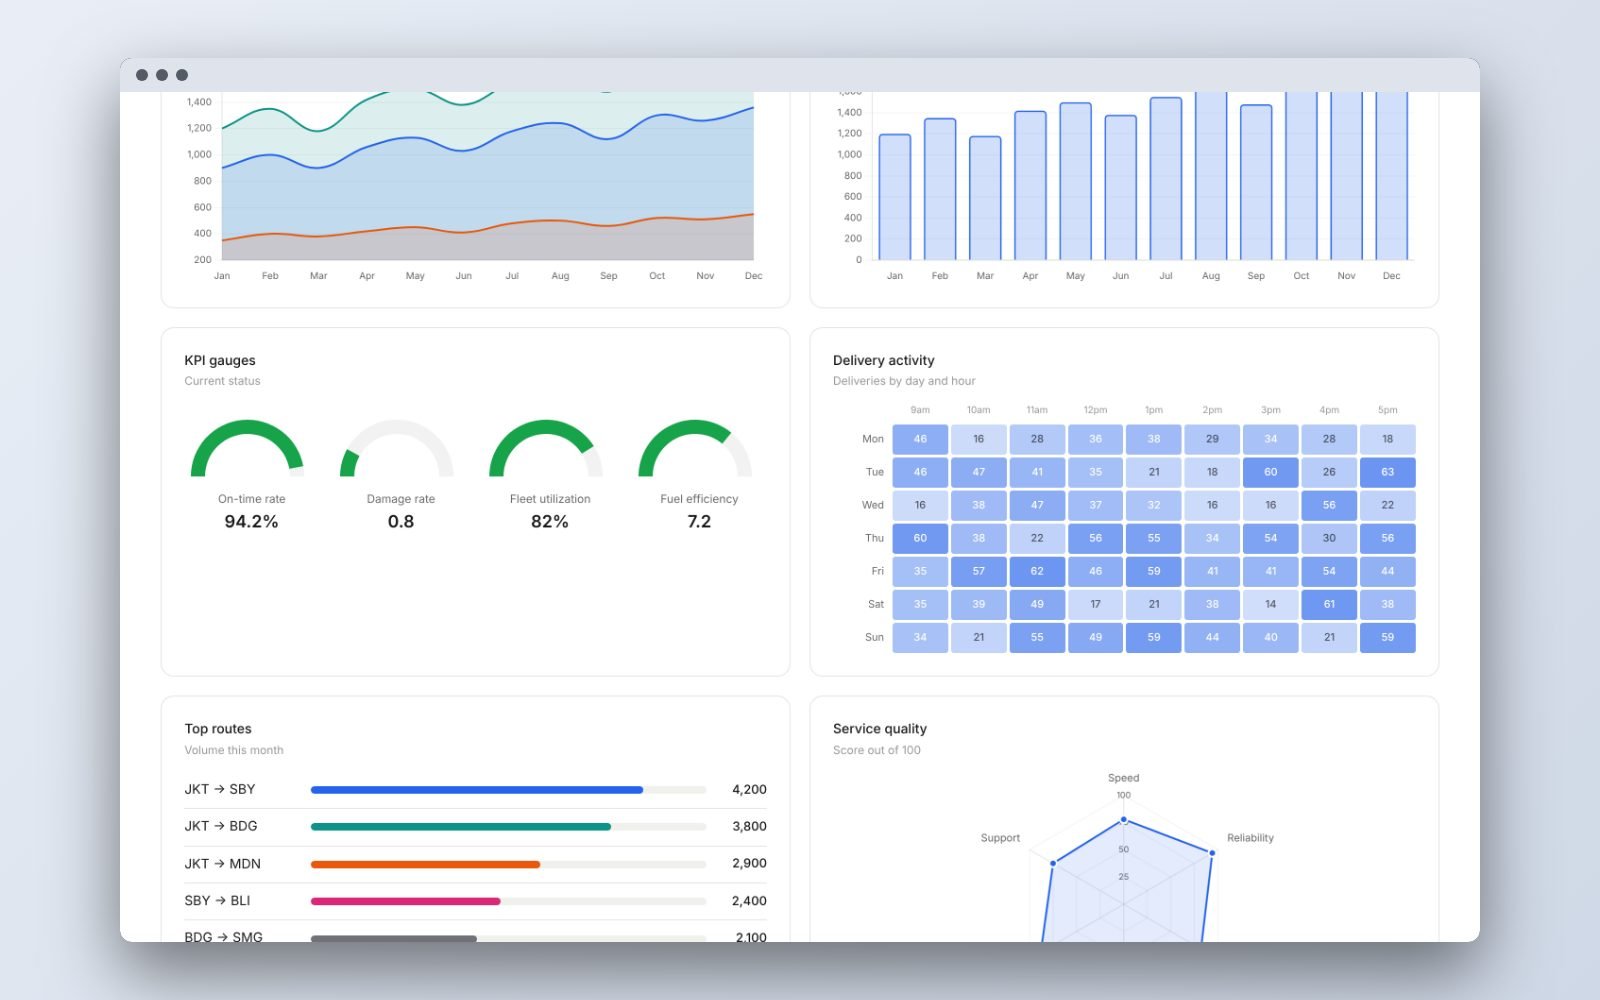
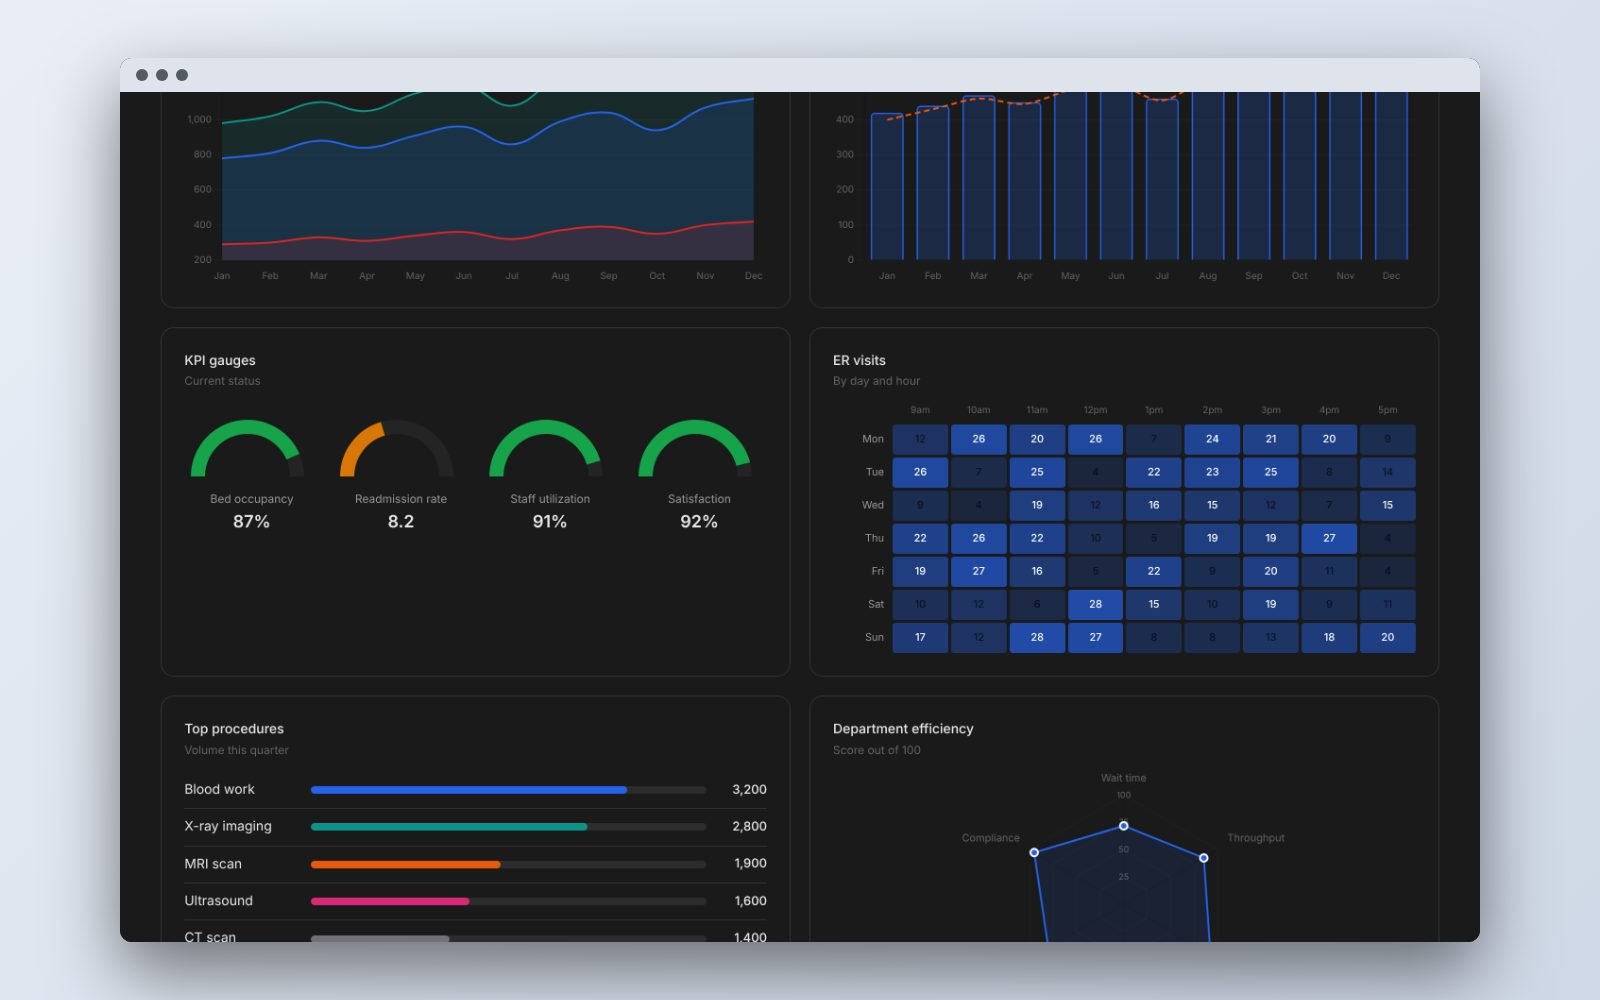
At its core is a visualization library of 15 types, from simple line and bar charts to combo, scatter, bubble and radar charts, KPI gauges, heatmap grids and progress bars. The same library is shown in action on sample dashboards for four very different industries: e-commerce, logistics, healthcare and telecom. The industries are examples, not a limit. The charts adapt to whatever a business measures, whether that is orders, shipments, patient visits or network load.
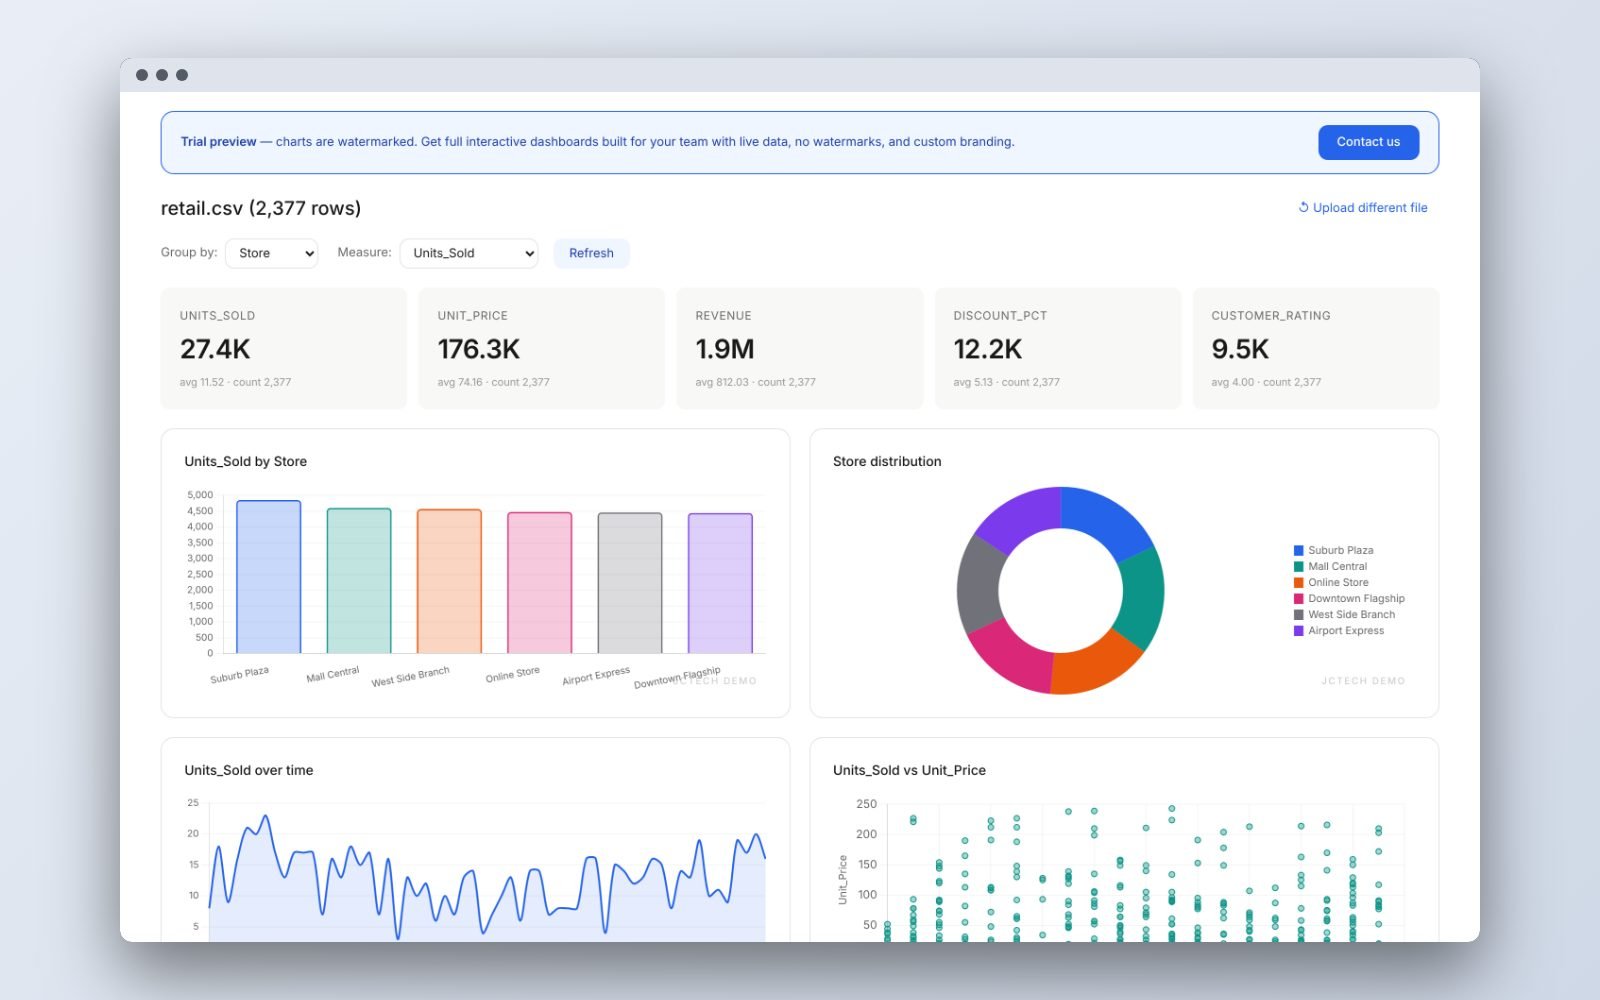
Visitors can also bring their own data. Any CSV file is turned into charts automatically, with controls to change the grouping and measure. Sample datasets for retail sales, marketing, HR & people, and IoT & sensors are included for anyone without a file to hand. Everything runs in the browser, so uploaded data never leaves the visitor’s computer. Charts from uploads are watermarked as a preview, with a clear next step to talk to us about a full dashboard on live data.
Key Features
- Visualization library of 15 types: line, bar, horizontal bar, stacked bar, doughnut, polar area, stacked area, multi-line, combo bar + line, scatter, bubble and radar charts, plus KPI gauges, heatmap grids and progress bars
- Sample dashboards for four industries (e-commerce, logistics, healthcare, telecom), each with its own KPIs and metrics
- KPI cards with trend sparklines
- Upload any CSV: columns detected and charts built automatically
- Group-by and measure selectors to explore uploaded data
- Sample datasets to try: retail sales, marketing, HR & people, IoT & sensors
- Runs fully in the browser, so uploaded data stays private
- Interactive tooltips, light and dark mode, responsive on desktop and mobile